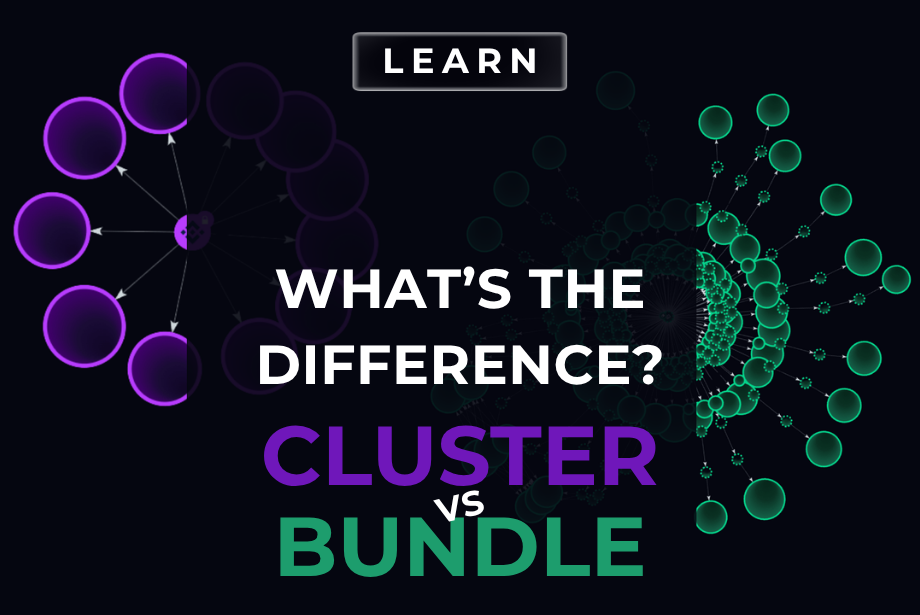
What's the Difference Between Bundle & Cluster?
Two terms that look similar on a crypto bubble map,but reveal very different things about a token's health and holder structure.
When you open a crypto bubble map for the first time, you'll see a web of wallets, colors, and connections. Two patterns stand out again and again: bundles and clusters. Knowing which is which could save your portfolio.
Bubblemaps is the leading crypto bundle checker and on-chain visualization tool, used by traders, researchers, and risk analysts to understand who really holds a token. Whether you're investigating a fresh meme coin bubble map or scanning a major project on Bubblemaps solana, you'll encounter both bundles and clusters constantly.
These two concepts are often confused even though they represent fundamentally different risks and realities. Let's break them down.
The core distinction
Both bundles and clusters describe groups of crypto wallets that appear linked in some way. The difference lies in how they're linked — and what that linkage tells you.
A set of wallets that transacted together during the token launch: typically all buying in the same block or within the same snipe window. The link is temporal and transactional.
A set of wallets linked by on-chain behavior over time: shared funding sources, coordinated transfers, or recycled addresses. The link is structural and behavioral.
In short: a bundle is about when wallets bought. A cluster is about how wallets behave.
Bundles: the launch snipe signal
A bundle is detected when multiple wallets buy a token in the same transaction block, or within seconds of each other at launch. This is the classic fingerprint of a solana volume bot or a coordinated team pre-loading supply before public trading begins.
Bundles are a key crypto rug pull indicator. When a team or set of snipers holds a massive coordinated position from block zero, they can dump simultaneously at any peak - leaving retail traders with a worthless bag. A strong bundle holding is one of the first things experienced analysts check on bubblemaps for sol.
Key bundle signals to watch:
- Same-block purchases: dozens of wallets buying in block 1 or 2 of a token's life
- High supply concentration: a bundle holding 10%+ of total supply is a major red flag
- No prior history: bundle wallets are often freshly created specifically for the snipe
- Dormancy then activity: bundled wallets that go quiet and suddenly sell together signal coordinated exit
Clusters: the behavioral fingerprint
A cluster is identified differently. Rather than looking at timing, Bubblemaps analyzes on-chain relationships: which wallets were funded from the same source, which addresses sent tokens to each other, and which wallets share patterns across multiple tokens.
Clusters can form organically: a group of friends who all funded their wallets from the same exchange withdrawal, for example. But in the context of a crypto bubble map investigation, large clusters often indicate a single entity controlling multiple wallets to disguise supply concentration.
Key cluster signals to watch:
Shared funding source: many wallets funded from the same original address or bridge transaction
Cross-token recurrence: the same wallet cluster appears on multiple token launches
Internal transfers: tokens moving between wallets in the cluster before hitting exchanges
Wash trading: clusters are a common tool for artificially inflating volume to fool bots and trend trackers
Side-by-side comparison
table
How to use this on Bubblemaps
When you load any token's crypto bubble map, you'll see bubbles sized by wallet holdings and colored by connection type. Clusters are visually grouped, you'll notice tightly interconnected networks of similarly-colored nodes. Bundles appear as a timestamp badge or dedicated analysis tab, showing you exactly what % of supply was sniped at launch.
For meme coins especially, where the window between launch and peak is sometimes minutes, checking both bundle % and cluster connections on Bubblemaps sol gives you a near-complete picture of insider risk before you buy a single token.
The combination is powerful: a token might have no visible bundle (buys were spread across blocks) but a massive cluster of linked wallets controlling 30% of supply. Without a proper crypto bundle checker, that would be nearly invisible to the average buyer.