What Is Bubblemaps? The Visual Onchain Analytics Tool Explained
Most on-chain analytics tools give you data. Bubblemaps gives you a picture.

That distinction matters more than it might seem. Raw blockchain data is public, but it's also overwhelming. Thousands of wallet addresses, millions of transactions, and no obvious way to see who's connected to whom or who actually controls a token's supply. Bubblemaps solves that by turning all of that data into an interactive visual map where the relationships between wallets become immediately readable, even if you've never looked at a blockchain explorer in your life.
This guide explains what Bubblemaps is, how it works, what it shows you, and why it has become one of the most widely used tools in crypto for token research, scam detection, and on-chain investigation.
The Core Idea: Wallets as Bubbles
The name is literal. Bubblemaps represents each significant token holder as a bubble. The size of the bubble corresponds to the percentage of the token supply that wallet holds. The bigger the bubble, the bigger the position.
What makes it more than a pie chart is the connections. When Bubblemaps detects that two or more wallets are likely controlled by the same entity, it draws a line between them and gives them the same color. These groupings are called clusters, and they are the central insight the tool provides.
A cluster of ten wallets, each holding 2% of supply, looks like ten separate holders at first glance. On a standard top holder list, those wallets appear unrelated. On Bubblemaps, they're grouped by color with lines connecting them, making it immediately clear that a single entity controls 20% of the supply. That information changes everything about how you assess that token.
What Bubblemaps Is Used For
Bubblemaps is used across several overlapping use cases, often by the same person in the same research session.
Token due diligence before investing. Before putting money into any token, you can open its bubblemaps and assess the distribution of supply in seconds. Is the supply spread across hundreds of independent wallets, or is it concentrated in a few connected clusters? The answer shapes every other judgment you make about the token.
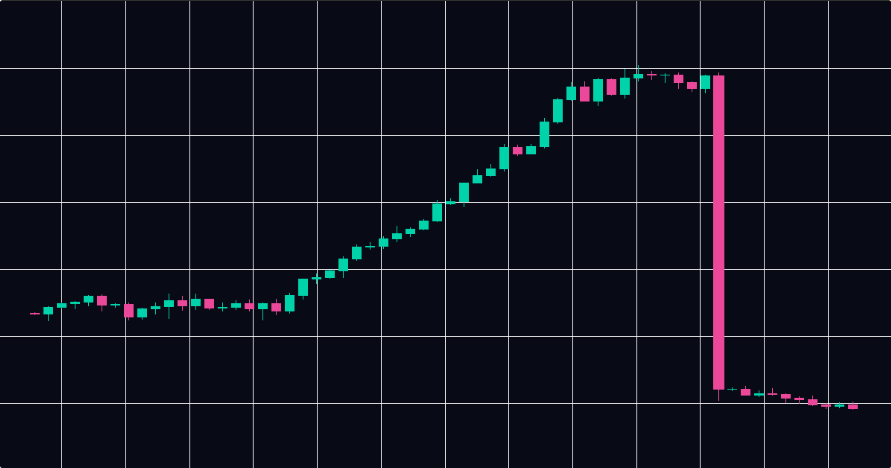
Rug pull and scam detection. Coordinated wallet clusters, deployer-connected holdings, and bundled launch buys are the fingerprints of tokens designed to extract money from retail buyers. Bubblemaps makes these patterns visible before the exit happens, giving investors a chance to avoid them.
Meme coin analysis. Meme coins launch fast and attract attention before most people have had a chance to look at the on-chain data. Bubblemaps is fast enough to be useful in that window, letting traders assess distribution quality in the first minutes of a token's life.
Whale and insider monitoring. Once you've identified the significant wallets in a token, you can watch how their positions change over time. A large cluster that starts selling is visible in the data before it's visible in the price.
Onchain investigation and research. Journalists, analysts, and community researchers use Bubblemaps to trace fund flows, identify wallet relationships, and build cases around suspicious on-chain activity. Several high-profile crypto investigations have used Bubblemaps data as a core source.
Portfolio and market intelligence. Beyond individual tokens, Bubblemaps provides a layer of intelligence about how supply is distributed across the broader market, which tokens have healthy holder bases, and which ones are structurally fragile.
How the Wallet Clustering Works
The clustering algorithm is what makes Bubblemaps more powerful than a standard holder list. It analyzes on-chain transaction patterns to identify wallets that are likely controlled by the same person or group.
The signals it uses include:
Funding relationships. If Wallet A sent BNB or SOL to Wallet B, and Wallet B then bought a token, those wallets are behaviorally linked. Bubblemaps traces these funding chains and groups the downstream wallets with their source.
Synchronized behavior. Wallets that consistently buy and sell the same tokens at the same times, or that transact in coordinated patterns across multiple tokens, are flagged as likely related. This catches sophisticated actors who try to obscure connections by using wallets that have never directly transacted with each other.
Launch-block activity. Wallets that purchased a token in the same block as the launch, or within the first few blocks, are analyzed together. This is the basis of the bundle detection feature, which identifies coordinated launch-time accumulation.
Common transaction counterparties. Wallets that repeatedly interact with the same third-party addresses, even if they've never interacted with each other directly, can be identified as part of the same operational network.
The result is a grouping that goes beyond what any block explorer can show. You're not just seeing who holds the token. You're seeing who is connected to whom, and by extension, whose selling behavior is likely to be correlated.
The Key Features of Bubblemaps
Interactive bubble map
The core visualization. Every significant holder of a token is represented as a bubble, sized by supply percentage. Connected wallets share a color. You can click any bubble to see the wallet address, its supply share, and its connections. You can zoom, pan, and rearrange the map to explore the relationship structure of any token.
Token distribution overview
A summary view of how supply is distributed across categories: the top clusters, exchange wallets, liquidity pool wallets, and the broader retail holder base. This gives you a quick read on the overall health of a token's distribution without needing to interpret the full visual map.
Bundle checker
A dedicated tool that analyzes the launch transaction history of a token and identifies wallets that coordinated their buys at or near the launch block. The result is a percentage: how much of the total supply was bundled by coordinated wallets at launch. A high bundle percentage is one of the clearest signals of an engineered launch designed to benefit insiders at retail's expense.
Historical token holders map
One of the most underused and most powerful features. The historical map lets you navigate back to any point in a token's history and see what the distribution looked like at that moment. You can compare the distribution at launch versus at a price peak versus today, and the changes tell a story about what the insiders did and when.
Whale wallet tracker
A monitoring layer that tracks the largest wallets in a token over time. Instead of checking the map manually every day, you can watch for movement from significant holders and get an early signal when large positions start to shift.
Onchain investigation tools
Bubblemaps includes tools designed for more in-depth research: fund flow tracing, wallet history exploration, and the ability to flag and annotate wallets for ongoing investigation. These features are used heavily by the community researchers and analysts who contribute to the Intel Desk.
Multi-chain support
Bubblemaps supports all the major chains where token activity is concentrated: Ethereum, Solana, BNB Chain, Base, Tron, Polygon, Avalanche, TON, and others. The interface and methodology are consistent across chains, so the skills you develop analyzing tokens on one chain transfer directly to any other.
Bubblemaps V2
The current version of Bubblemaps is V2, which represents a significant expansion of the platform's capabilities beyond the original token distribution visualizer.
V2 introduced real-time data updates, deeper wallet exploration, improved clustering algorithms, and the full historical map feature. It also introduced Magic Nodes, a feature that surfaces contextual information about specific wallet types automatically. When a wallet is identified as belonging to a known exchange, a known project, or a flagged bad actor, that context appears in the map without requiring manual research.
The Intel Desk is the other major addition in the V2 era. It's a community-powered investigation platform where analysts submit research cases, the community votes on which investigations to prioritize, and findings are shared publicly. Cases have included investigations into celebrity token launches, exchange hacks, and coordinated manipulation schemes. Several Intel Desk investigations have been picked up by major crypto media and cited in regulatory discussions.
Who Uses Bubblemaps
Bubblemaps is used by a wide range of people across the crypto ecosystem, and understanding who uses it helps clarify what it's for.
Retail investors and traders use it for pre-investment research on tokens they're considering, particularly meme coins and newer projects where the risk of insider manipulation is highest. The visual format makes it accessible even to people without a background in blockchain data.
Crypto researchers and journalists use it as a primary source for on-chain evidence in investigative reporting. The ability to visualize wallet connections and trace fund flows makes it much faster to build a coherent narrative from raw blockchain data.
Project teams and developers use it to demonstrate the health of their own token distribution to potential investors and their community. A clean bubble map is increasingly cited as a positive signal in token launches.
DeFi protocols and analytics platforms integrate Bubblemaps via API or iframe, embedding the visualization directly into their own products. This means Bubblemaps data appears in tools like DEXTools, DexScreener, CoinGecko, Axiom, Trojan, and others, often without users realizing they're looking at Bubblemaps data.
Security researchers and compliance teams use it for due diligence and investigation work, tracing the movement of funds associated with exploits, scams, or sanctioned entities.
How Bubblemaps Fits Into Your Research Stack
Bubblemaps is not the only on-chain analytics tool, and it works best when used alongside others. Block explorers like Etherscan or Solscan let you verify the underlying transactions that Bubblemaps surfaces visually, while platforms like Nansen, Arkham, and Dune offer complementary angles on wallet behavior and fund flows. What Bubblemaps does better than any of them is make token distribution and wallet relationships instantly readable without requiring technical knowledge or hours of manual tracing.
The $BMT Token
Bubblemaps has its own token, $BMT, which powers access to premium features and aligns the incentives of the platform's most active users with its continued development. $BMT is listed on several major exchanges and has its own bubble map on the platform, which the team has maintained as a demonstration of the kind of healthy distribution they advocate for in the broader ecosystem.
Why On-chain Visualization Matters
The fundamental promise of blockchain technology is transparency. Every transaction is public, every wallet balance is verifiable, and no one can secretly move funds without leaving a trace. But transparency only has value if people can actually read the data.
For most of crypto's history, the gap between "the data exists" and "anyone can understand it" has been enormous. That gap is where scams, rug pulls, and insider manipulation have thrived. The data to detect them was always there. The tools to make it readable weren't.
Bubblemaps is one of the tools that closes that gap. By making wallet relationships visual and immediately interpretable, it shifts the information balance toward the retail investor and away from the sophisticated actors who have historically benefited from the opacity of raw blockchain data.
That's the real value proposition. Not just a pretty chart, but a genuine shift in who can access and act on on-chain information.
Getting Started
Bubblemaps is free to use for core features. Go to bubblemaps.io, select a chain, and paste any token contract address. The map loads in seconds.
If you're new to it, start with a token you already know well. Pull up the map for a major token like a well-known stablecoin or a blue-chip project and get familiar with what a healthy distribution looks like. Then pull up a token you've been suspicious of and see what the map tells you.
The visual language becomes intuitive quickly. Within a few sessions, you'll be reading bubble maps the way experienced traders read price charts: fast, pattern-based, and with a clear sense of what looks normal and what doesn't.
Ready to go deeper? Read our guides on How to Use Bubblemaps: A Step-by-Step Guide for Beginners, How to Spot a Rug Pull Using Bubblemaps (Before It Happens), and How to Analyze Meme Coin Holders with Bubblemaps.