NEW: Charts Now Live Inside the Maps

You can now read price action and on-chain holder structure at the same time, on the same screen!
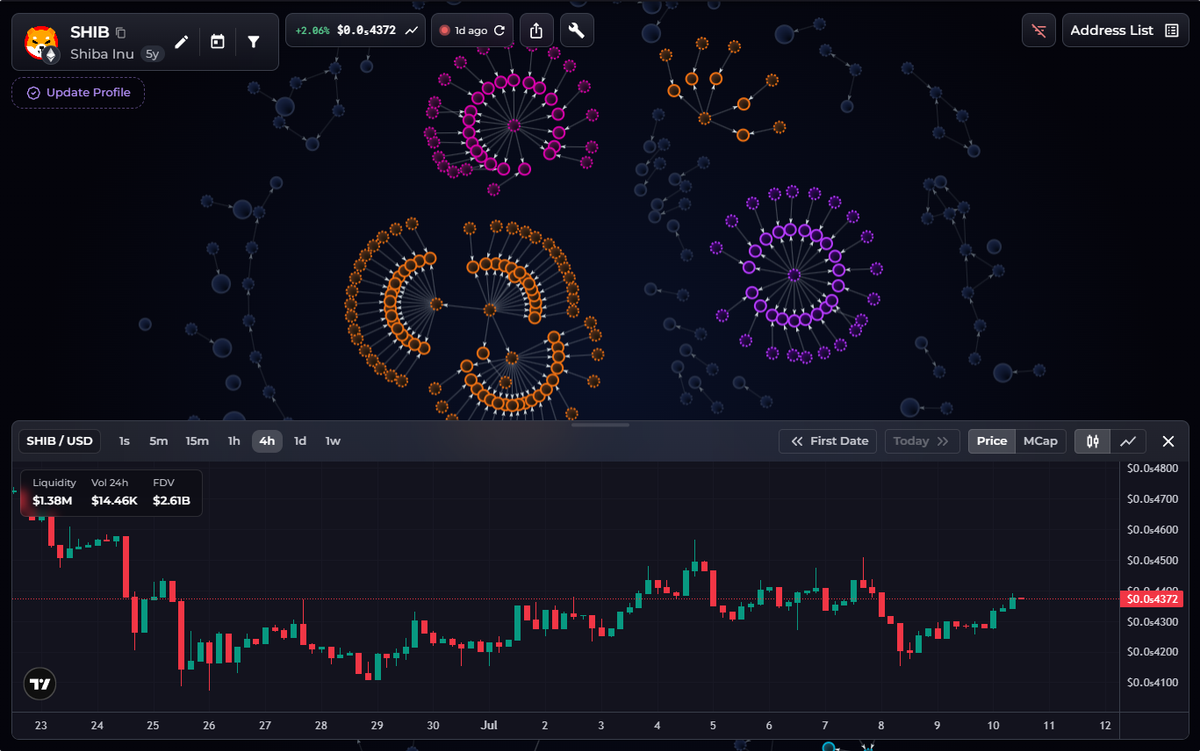
We've added charts directly inside all our bubble maps. Every token page on Bubblemaps now has a chart panel right below the map, synced to the exact token you're inspecting, so you can cross-reference price and holders in one view, in one tab.
What you can do with it
This is a focused chart view tuned for what you actually need when you're checking a bubble map:
- Timeframes from 1 second to 1 week. Toggle between 1s, 5m, 15m, 1h, 4h, 1d, and 1w . Optimal for when you're watching a fresh launch or zooming out on a macro move.
- Candle or line chart. Switch styles in one click depending on whether you want to read wicks or follow the trend.
- Price or Market Cap on the right axis. Flip the secondary Y-axis between Price and MCap to read valuation moves the way you think about them.
- First Date/Today shortcuts. Jump straight to a token's earliest data or back to the live candle in one click, no scrolling needed!
- Liquidity, Vol 24h, and FDV on the chart itself. The market stats you actually care about sit right on the left side of the panel, no need bouncing to a separate tracker to cross-check
Why it matters
The point is making the chart useful inside a Bubblemaps workflow. Watch a top cluster thin out on the map while a breakout candle prints underneath. Check what a top wallet is doing into a flat tape versus a vertical move. Read the holder story against the price story, in one tab, without context-switching.
How to use it
- Open any token-map on Bubblemaps:
- Click the chart button in the top left corner
- Check this map live right there is the TradingView panel
- Change timeframes, switch between 1s, 5m, 1h, 4h, 1d, 1w chart candles
Click here to explore the new chart in Bubblemaps, or click here to check the underlying chart on TradingView.