How to Use Bubblemaps: A Step-by-Step Guide for Beginners
If you've heard about Bubblemaps but haven't used it yet, this guide is for you. By the end of it, you'll know how to look up any token, read the bubble map, interpret what you're seeing, and use the core features that make Bubblemaps one of the most useful tools in crypto research.

No prior experience with onchain analytics is required. If you know what a crypto wallet is and have a basic understanding of tokens, you have everything you need to follow along.
What You'll Learn
This guide covers:
- How to open Bubblemaps and look up a token
- How to read the bubble map and understand what the visuals mean
- How to identify wallet clusters and what they tell you
- How to use watch for bundles
- How to navigate the historical map
- How to explore individual wallets
- A few practical habits to build into your research routine
Step 1: Open Bubblemaps
Go to bubblemaps.io and click Launch App. This takes you to the main application at v2.bubblemaps.io.
You don't need an account to use the core features. The app loads directly in your browser.
At the top of the screen you'll see a search bar and a chain selector. The chain selector lets you choose which blockchain you want to search on. Bubblemaps supports Ethereum, Solana, BNB Chain, Base, Tron, Polygon, Avalanche, TON, and others.
Step 2: Find the Token You Want to Analyze
You can search for a token two ways: by name or by contract address.
Searching by name works for well-known tokens. Type the token name or ticker into the search bar and select it from the dropdown.
Searching by contract address is more reliable, especially for newer or less established tokens where the name might not be indexed yet. Paste the full contract address into the search bar and hit enter.
If you're researching a token you found on a DEX aggregator like DexScreener or DEXTools, the contract address is always displayed prominently on those platforms. Copy it from there and paste it directly into Bubblemaps.
Step 3: Read the Bubble Map
Once your token loads, you'll see the bubble map. Take a moment before clicking anything and just look at the overall shape of it.
What the bubbles represent
Each bubble is a wallet that holds the token. The size of the bubble corresponds directly to the percentage of total supply that wallet holds. A large bubble means a large position. A tiny bubble means a small one.
What the colors mean
This is the most important thing to understand about the map. Bubblemaps assigns the same color to wallets it has identified as likely controlled by the same entity. These groups are called clusters.
If you see five bubbles all in the same shade of orange, connected by lines, that means Bubblemaps believes those five wallets are operated by the same person or group. Even if each wallet individually holds only 3% of supply, together that cluster holds 15%, all in the same hands.
Wallets that appear in gray or without connections to others are unidentified as part of any cluster. They may be independent retail holders, exchange wallets, or liquidity pool contracts.
What the lines mean
Lines between bubbles indicate a detected relationship. The relationship could be a direct funding connection (one wallet sent funds to another) or a behavioral connection (the wallets have transacted in coordinated patterns).
Reading the map at a glance
A healthy distribution looks scattered and colorful in a varied way: many bubbles of different sizes, few connections between the largest ones, and no single color dominating the map.
A concerning distribution looks consolidated: one large cluster of the same color taking up a significant portion of the map, with lines connecting many of the top holders back to the same source.
Step 4: Click Into Individual Wallets
Click any bubble to open the wallet detail panel. This shows you:
- The wallet address (you can copy it to look up on a block explorer)
- The percentage of total supply this wallet holds
- The wallet's rank among all holders
- Any label Bubblemaps has assigned to it (for example: "PumpSwap LP," "Binance," or "Deployer")
- Its connections to other wallets in the map
Clicking a wallet also highlights all of its connections in the map, making it easy to see which other bubbles belong to the same cluster.
If you want to investigate a wallet further, copy the address and paste it into Etherscan, Solscan, or whichever block explorer matches the chain. This lets you see the full transaction history for that wallet, which is useful for confirming what Bubblemaps is showing you at a high level.
Step 5: Check the Top Holders Panel
On the right side of the screen, you'll see the Address List panel. This is a ranked list of the top holders by supply percentage.
Scroll through the top 20 to 30 holders and pay attention to a few things:
Are multiple entries the same color? If holders ranked 2, 5, 7, and 11 all share the same color, they're in the same cluster. Add their percentages together to get the true combined holding.
Are any wallets labeled? Bubblemaps automatically labels known wallet types. CEX labels (Binance, Coinbase, Kraken, etc.) indicate exchange custody wallets, which are not insider positions. LP labels indicate liquidity pool wallets. Deployer labels flag the wallet that launched the contract. These labels save you significant research time.
What does the top holder alone control? On Solana meme coins especially, it's common to see a single liquidity pool wallet at number one with 10 to 15% of supply. That's normal. What's not normal is an unlabeled wallet at number one with 20%+ and connections to several other top holders.
The liquidity pool wallet is usually 'hidden' from the map, you can view it by clicking the eye-icon in the holder panel.
Step 6: Check for Bundles in Meme Coins
Here is how to interpret clusters:
Under 5%: Normal range. Some wallets will always snipe a new launch. This is not a significant concern on its own.
5 to 15%: Worth noting. Track these wallets to see whether they're holding or distributing.
15 to 30%: Serious concern. A meaningful share of supply was pre-bought by a coordinated group. Those wallets have a structural advantage and will likely sell before or into retail exits.
Over 30%: The launch was engineered. A large coordinated group accumulated supply before the public had access. Combined with high holder concentration, this is one of the clearest signals to avoid a token.
Always check for bundles on any new token you're considering, especially if it's under 48 hours old. It takes seconds and gives you information that isn't visible anywhere else without hours of manual research.
Step 7: Use the Historical Map
The historical map lets you travel back in time and see what the token distribution looked like at any previous point. This feature is accessed through the clock or timeline control within the app.
Why it matters
The current state of the map only tells you part of the story. The historical map tells you how the token got to where it is now, which is often more revealing.
How to use it
Use the timeline slider or date picker to navigate to specific moments in the token's history. The three most useful points to check are:
At launch: What did the distribution look like when the token first went live? Was it already concentrated, or was supply spread across many wallets from the start?
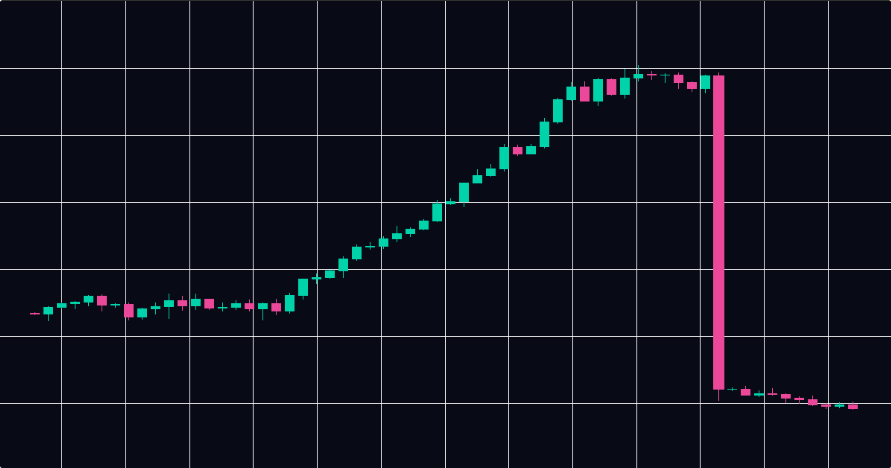
At the first major price peak: Who sold at the top? If a large cluster reduced its position precisely at the price peak, those wallets demonstrated they will do the same thing at the next peak. That's information you can use.
Today versus a week ago: Is the distribution becoming more or less concentrated? A token where supply is gradually spreading to more wallets is gaining genuine adoption. A token where supply is consolidating is seeing insiders accumulate into retail buying, which is a warning sign.
Practical example
Suppose you're looking at a token that's been trading for two weeks. The current map looks reasonably healthy. Before you invest, check the historical map at launch. If it shows a tight cluster controlling 40% of supply that has since spread out, that's good: the initial holders distributed. If it shows a tight cluster that has barely moved, those wallets are still holding a large position and could sell at any time.
Step 8: Understand the Labels Bubblemaps Uses
As you use Bubblemaps more, you'll encounter standard wallet labels that appear on bubbles and in the address list. Knowing what they mean speeds up your analysis significantly.
CEX (Centralized Exchange): Wallets belonging to exchanges like Binance, Coinbase, Kraken, or Bybit. These represent user custody, not insider positions. A large CEX wallet in the top holders means the token has exchange distribution, which is generally positive. CEX wallets are hidden by default to avoid confusion. If you unhide it in the holders panel, it would often show a big cluster.
DEX/LP (Liquidity Pool): The smart contract holding the token's trading liquidity on a decentralized exchange. This wallet will always appear large relative to total supply. It's not a holder in the traditional sense.
Deployer/Creator: The wallet that launched the token contract. Always pay close attention to this one. If it still holds tokens, those are potential sell pressure. If it sent tokens to a cluster of wallets at launch, those wallets are insiders.
Magic Nodes: Bubblemaps V2 introduced Magic Nodes, which automatically surface contextual information about specific wallets. When a wallet is identified as belonging to a known project, exchange, or flagged entity, that context appears directly in the map without you needing to look it up manually.
Step 9: Zoom, Filter, and Navigate the Map
The bubble map is interactive, and there are a few navigation basics worth knowing:
Zoom: Scroll to zoom in and out. Zoom in to see smaller wallets and their connections more clearly. Zoom out for the full overview.
Pan: Click and drag to move around the map.
Filter by cluster: Clicking a bubble highlights its cluster. This makes it easy to see the total footprint of a connected group across the whole map, even if the wallets are spread out spatially.
Rearrange: You can drag individual bubbles to rearrange the layout. This is useful when clusters are overlapping and you want to see the connections more clearly.
Search within the map: If you have a specific wallet address you want to find in the map, you can paste it into the address list search to locate and highlight it directly.
Step 10: Build It Into Your Research Routine
The most common mistake new users make is opening Bubblemaps only after something has gone wrong. The whole value of the tool is in using it before you invest.
Here's a simple routine to build:
Before buying any new token: Open the bubble map. Spend two minutes on the overview. If it looks heavily concentrated, either dig deeper or move on. Watch for bundles if the token is new. Check the deployer/creator wallet.
When holding a token: Check the map once every few days for any new cluster activity or large wallet movements. The historical comparison (today versus last week) is a quick way to spot distribution changes early.
When deciding whether to exit: Check the historical map at the last price peak and compare it to now. If the same wallets that sold last time are still holding large positions, consider whether you want to be holding when they sell again.
When researching a token someone else recommended: Don't take the chart or the community as your primary input. Open Bubblemaps first. If the on-chain reality matches the narrative, great. If it doesn't, you have information the recommender either doesn't have or chose not to share.
Common Mistakes to Avoid
Ignoring gray bubbles. Unconnected, unlabeled wallets are not automatically safe. Some sophisticated actors deliberately avoid on-chain patterns that trigger Bubblemaps' clustering. Gray doesn't mean innocent; it sometimes means unidentified.
Treating CEX wallets as red flags. A large Binance wallet in the top holders is almost always a positive sign, not a negative one. It means real users are custodying the token on a major exchange.
Looking at one metric in isolation. Bundle percentage alone doesn't tell the whole story. Concentration alone doesn't either. Read the map holistically: distribution shape, bundle data, historical trajectory, and deployer wallet behavior together give you a complete picture.
Only checking once. Meme coin distributions can change dramatically within hours or even minutes. If you're active in a volatile token, check the map more than once. A cluster that looked stable yesterday might be distributing today.
A Quick-Reference Summary
Here is a condensed version of the full workflow:
- Go to bubblemaps.io and launch the app
- Select the correct chain and search by contract address
- Look at the overall map shape before clicking anything
- Note the dominant colors and cluster sizes
- Click into the top holders and add up connected wallet percentages
- Check wallet labels (CEX, LP, Deployer)
- Watch for bundles in new tokens
- Open the historical map at launch, at the last price peak, and today
- Trace the deployer wallet and note what it holds or distributed
- Make your decision based on the on-chain picture, not the chart alone
Where to Go Next
Once you're comfortable with the basics covered here, there's a lot more depth to explore. The Intel Desk is a good place to see how experienced analysts use Bubblemaps in real investigations, and the case studies on the Bubblemaps site show the tool applied to high-profile situations like the $HAWK token collapse and other notable events.
The best way to get faster at reading maps is simply to open more of them. Look up tokens you already know well to build a baseline for what healthy looks like. Then look up tokens that turned out to be rugs (there's no shortage of historical examples) and study what the maps showed before the exit happened. That pattern recognition is what turns a two-minute check into a genuinely reliable research signal.
Continue reading: How to Spot a Rug Pull Using Bubblemaps (Before It Happens), or How to Analyze Meme Coin Holders with Bubblemaps.