How to Read Blockchain Data Like a Pro: A Beginner’s Guide
This guide shows how to move from a basic block explorer view to a full investigation that connects transactions, wallets, contracts, and liquidity into a single narrative.

We provide concrete steps, checklists, and workflows that help you detect concentration risk, trace flows, and validate projects with on-chain analytics.
For both beginners and advanced users, on-chain data analysis is the most direct way to measure token distribution, track liquidity, and confirm where power sits in a network.
1. Environment and Tooling
On-chain data analysis is clearer when your environment is organized. Set up a consistent toolkit and a repeatable workflow.
Choose your base explorers
- Etherscan, Basescan, Arbiscan, Solscan, and other chain explorers for raw transactions.
- Token scanners for supply, holders, and contract metadata.
- A web3 analytics platform that visualizes token distribution and wallet clusters.
Prepare a research log
- Table with columns: date, question, hypothesis, evidence (tx links), interpretation, risk, follow up.
- Save queries and links for reproducibility.
- Record assumptions explicitly and update when evidence changes.
Safeguards and hygiene
- Confirm the correct chain and contract address.
- Bookmark verified contracts to avoid lookalikes.
- Track time zones and absolute timestamps to avoid confusion.
2. Reading Transactions Step by Step
Transactions are the atomic units of blockchains. Reading them carefully is the first skill to master.
Anatomy of a transaction
- Hash, block number, timestamp.
- From, to, and value in native units.
- Gas limit, gas used, and gas price.
- Status and error messages.
Token transfers and logs
- Inspect logs for Transfer events on ERC-20 or SPL tokens.
- Note from, to, and value fields. Convert amounts using decimals from the token contract.
- Capture Approval events. Large approvals to DEX routers often precede swaps.
Contract calls and method decoding
- Use the decoded input tab to identify functions such as swapExactTokensForETH, addLiquidity, stake, or claim.
- Read output logs to confirm what was executed.
- Distinguish between router contracts and pool contracts to avoid mislabeling counterparties.
Pattern recognition
- Sequence analysis: several small approvals followed by a large swap indicate staged distribution.
- Time clustering: bursts of similar swaps around announcements reveal coordination.
- Bridge usage: large transfers into bridge contracts often precede cross-chain moves.
Red flag checklist
- Approvals to unknown spenders with very high allowances.
- Swaps routed through private pools or obscure routers.
- Frequent failed transactions that resemble sniping or frontrunning attempts.
3. Interpreting Wallet Behavior
Wallets reveal intent over time. The goal is to classify entities and detect coordination.
Classify the wallet
- Exchange deposit or hot wallet: many small inbound deposits and large periodic merges.
- Team or deployer: receives tokens from the contract or treasury, funds multiple related wallets.
- Market maker: frequent interactions with pools and routers, rebalancing patterns.
- Retail cluster: sparse activity with small, varied counterparties.
Trace history and flows
- Build a ledger of inflows and outflows by token and period.
- Tag recurring counterparties and note bridges and custodians.
- Compare behavior before and after listings or unlocks.
Detect accumulation and distribution
- Rising net balance across wallets signals accumulation.
- Transfers to exchange deposit addresses signal distribution.
- Repeated routing through one intermediary confirms a coordinated cluster.
Validate labels
- Cross reference explorer labels with your own heuristics.
- Beware of shared exchange addresses that make individuals look like clusters.
4. Understanding Blocks and Network State
Blocks show demand for blockspace and execution health.
Read block metadata
- Timestamp and block interval indicate throughput.
- Gas used and base fee reflect demand.
- Miner or validator identity matters for incentives and MEV patterns.
Interpret spikes and slowdowns
- Fee spikes align with mints, airdrops, or narrative rotations.
- Sustained high gas costs push out smaller actors.
Extract signals
- Rising fees with flat user counts reveal bot congestion rather than adoption.
- Falling fees with rising transactions confirm efficiency gains.
5. Reading Smart Contracts Without Coding
Audit contract properties with explorers and a checklist.
Verify the right implementation
- Check if the token uses a proxy pattern. Look for implementation slots or EIP-1967 storage.
- Open the implementation contract and confirm the verified source and compiler settings.
Owner roles and permissions
- Identify owner, admin, or AccessControl roles.
- Look for functions that alter balances: mint, burn, pause, blacklist, setFees, updateRouter.
- Confirm if ownership is renounced or time-locked. Note timelock parameters.
Supply schedule and vesting
- Read vesting contracts for cliffs, linear release rates, and beneficiary lists.
- Note if team or investor tokens are locked in reputable lockers and for how long.
Liquidity controls
- For AMM tokens, identify whether LP tokens are locked and until when.
- On concentrated liquidity AMMs, inspect position ranges to see if liquidity is narrow and easy to pull.
Event map
- Map key events: Transfer, Mint, Burn, Sync (AMMs), Deposit and Withdraw (staking).
- Use events to reconstruct state changes when storage reads are not trivial.
6. Visualizing Blockchain Data in Practice with Bubblemaps
Bubblemaps transforms raw token holder data into visual clusters.
It is purpose-built for detecting wallet concentration, coordination, and distribution risk. For readers new to visualization of blockchain data, Bubblemaps simplifies token distribution analysis into patterns you can see at a glance.
How Bubblemaps works
- Search for a token by name or contract and select the chain.
- The platform plots the top 250 holders as bubbles. Larger bubbles hold more tokens.
- Links between bubbles reflect transfers. Dense links form clusters worth investigating.
Bubbles and holders
- Each bubble is a top holder. Hidden bubbles often represent exchanges or contracts. You can reveal them when needed.
- Supernodes represent wallets with extreme volume, such as exchange hot wallets. They are labeled to prevent distortion.
- Clicking a bubble reveals % supply held, balance, USD value, and cluster data.
Links and transfers
- A link means a transfer occurred between two holders. In V2, these links can span multiple tokens or chains.
- You can inspect IN/OUT to see direction, token, and date of last transfer.
- Use the Transfers & Tokens menu to filter by asset or value to focus on significant flows.
Magic Nodes
- Default views only show current holders. Magic Nodes adds non-holder addresses that still connect top holders.
- This uncovers hidden clusters, such as several whales receiving funds from the same wallet.
- Example: in $SHIB, Magic Nodes revealed connections between holders through a drained intermediary address, showing coordinated distribution.
Time Travel
- Token distributions shift over time. Time Travel lets you rewind to any prior date to view past distributions.
- This is vital for launches, unlocks, and listings. You can confirm whether early supply was concentrated among insiders.
- Example: $NEIRO launch maps showed heavy early clustering, later dispersed.
Adding and importing addresses
- Paste addresses manually into the Address List.
- Use Show All Transfers to surface connections beyond the map and filter by direction, token, or value.
- Import bulk addresses from clipboard or CSV exports to scale research.
Scaling, sharing, and exporting
- Increase holder view to top 500 or 1,000 where available.
- Share exact map states with permalink, including filters and timeframes.
- Export addresses to spreadsheets for further tracing or monitoring.
Premium features
- Bubblemaps V2 is free and includes Magic Nodes, Time Travel, and refresh within ~6 hours.
- Premium options for $BMT holders include P&L computation, cross-chain analytics, AI cluster models, and expanded holder sets.
Workflow integration
- Spot a suspicious transaction on Etherscan.
- Locate the wallet in Bubblemaps.
- Toggle Magic Nodes to reveal intermediaries.
- Use Time Travel to compare current and past supply control.
- Export clusters and set alerts with your monitoring tools.
7. Liquidity and Market Microstructure
Liquidity determines how easily tokens can be traded without moving the price.
Reading liquidity data shows how robust a market is and how vulnerable it may be to manipulation.
In many cases, weak liquidity combined with concentrated token distribution crypto projects signals fragility.
Pools and reserves
- Open the token’s pools on DEX explorers.
- Record reserve balances for both the token and its pair ($ETH, $USDC, etc.).
- Check how many pools exist. Reliance on one pool increases fragility.
Effective depth and slippage
- Use swap simulators to measure slippage on different trade sizes.
- Compare across pools. A token with only one deep pool is more exposed to sudden liquidity removal.
Liquidity ownership and locks
- Identify the wallets holding LP tokens. If team wallets dominate, they can pull liquidity.
- Inspect lock contracts. Note durations and percentages.
- On concentrated AMMs, read tick ranges to see if liquidity is narrow and easy to withdraw.
Exchange flows
- Track CEX deposit addresses for large inbound spikes. Rising deposits often precede selling.
- Distinguish organic flows from exchange reshuffling by analyzing timing and sizes.
Why it matters
Liquidity is the difference between orderly trading and catastrophic slippage.
Mapping who owns it and how it is positioned is central to on-chain analysis and complements visualization of blockchain data for a fuller view.
8. Building a Data Narrative
Professional readers do not stop at raw numbers. They build narratives that explain behavior, predict risks, and can be tested.
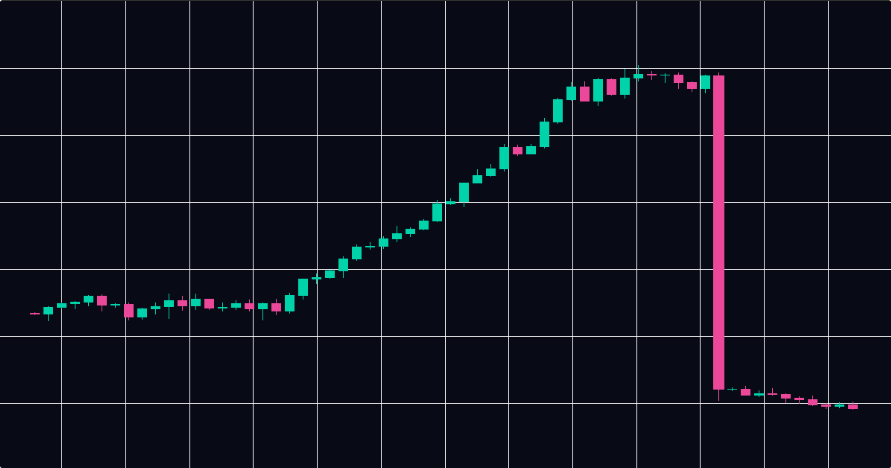
Start with a hypothesis
Formulate a clear statement. Example: “$TOKEN’s rally is driven by insiders preparing to distribute.”
Collect evidence across layers
- Transactions: large approvals or swaps into stablecoins.
- Wallets: clusters that accumulated now moving to exchanges.
- Blocks: fee spikes coinciding with major transfers.
- Contracts: vesting unlocks visible in schedules.
- Bubble maps: clusters showing coordination and token distribution.
- Liquidity: shallow pools with unlockable LP tokens.
Score and interpret
- Rank evidence by strength and reliability.
- Consider alternative explanations such as market makers rebalancing.
- Mark what new evidence would strengthen or falsify the hypothesis.
Present the story
- Create a report with transaction links, bubble map exports, liquidity screenshots.
- Use visuals to make distribution patterns clear.
- Share confidence level and risk assessment.
9. Practical Playbooks
Turn these processes into repeatable checklists.
Before entering a position
- Verify contract ownership and sensitive functions.
- Inspect vesting schedules and token release mechanics.
- Map token distribution with a bubble map. Flag oversized or linked holders.
- Measure liquidity depth, ownership, and lock status.
- Check exchange balances and flows with web3 analytics tools.
After listings or catalysts
- Re-run the bubble map to see changes in top holders.
- Monitor Magic Nodes to reveal intermediaries.
- Compare liquidity depth before and after pumps.
- Track whale deposits into exchanges.
Ongoing monitoring cadence
- Daily: exchange flows, whale transfers, LP changes.
- Weekly: distribution changes, cluster formation or dissolution.
- Event-driven: airdrops, unlocks, governance votes, listings.
Investigator workflow
- Start with explorer scans to tag deployer, treasury, and top wallets.
- Import addresses into bubble maps to visualize relationships.
- Toggle Magic Nodes and Time Travel to detect coordination or changes over time.
- Export addresses and build alerts in your web3 analytics platform.
10. Common Pitfalls, Limits, and Validation
Even experienced analysts encounter traps. Recognize them and validate carefully.
Data freshness
- Confirm refresh time of visualization tools.
- Validate explorer data against multiple sources such as Etherscan, Solscan, or Nansen.
- Cross-check with web3 analytics tools for consistency.
Cross-chain confusion
- Tokens bridged to multiple chains create noise. Confirm contract addresses on each chain.
- Watch for wrapped tokens inflating holder counts.
Labeling risk
- Labels are helpful but imperfect. Validate clusters through repeated fund flow patterns.
- Supernodes, custodians, and exchanges can blur distinctions.
Narrative bias
- Do not force a story. Seek disconfirming evidence.
- Separate facts, inferences, and hypotheses clearly in your notes.
From Analysis to Action
Reading blockchain data like a pro means connecting explorers, analytics tools, and Bubblemaps into a single workflow.
Start by using explorers to confirm raw transactions. Add web3 analytics tools to widen your view. Then move into Bubblemaps to visualize token distribution and wallet clusters so you can see who actually controls flows.
Professional analysis is built on evidence and narrative. Document your findings, attach transactions and maps, and state the risks along with other possible explanations. Treat each investigation as a hypothesis you can test.
With repetition you will learn to read the chain with clarity and precision, turning raw data into a verifiable story of control and risk. This guide gives you the foundation.
The next step is yours: pick a token today and walk through the process end to end.
Written by: Uddalak Das