How to Analyze Meme Coin Holders with Bubblemaps

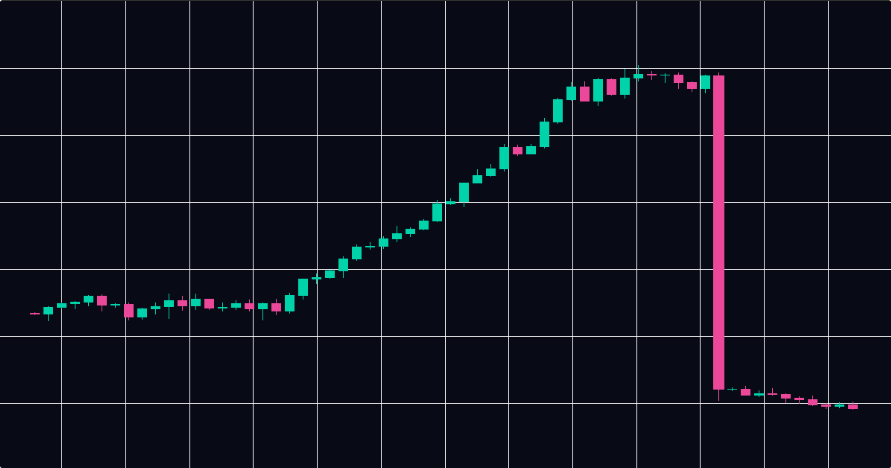
Memecoins move fast. A token can 10x in hours and collapse just as quickly, and the difference between riding that wave and getting wrecked often comes down to one thing: who is actually holding the supply.
Bubblemaps answers that question visually and instantly. Instead of combing through raw wallet data on a block explorer, you get an interactive map of every significant holder, how they're connected, and how the distribution has shifted over time. This guide walks you through how to use it specifically for meme coin analysis, from the moment a token launches to the point where you're deciding whether to hold or exit.
Why Meme Coins Require a Different Kind of Analysis
Meme coins don't have fundamentals in the traditional sense. There's no revenue, no product roadmap, no earnings call to parse. What drives price is narrative, community momentum, and liquidity. But underneath all of that, the on-chain reality matters more than almost any other token category.
Because meme coins launch fast and attract retail attention quickly, they're the preferred vehicle for insider exploitation. Bundled launches, coordinated wallet clusters, and stealth accumulation are endemic to the meme coin space. A token with a great ticker and a viral tweet can mask a distribution that's 60% controlled by five wallets.
Bubblemaps cuts through that. It doesn't tell you whether a meme coin will pump. What it tells you is whether the pump, if it happens, will benefit you or the insiders who got in before you.
Step 1: Open the Token and Read the Map at a Glance
Go to bubblemaps.io, select the chain (Solana, Ethereum, BNB, Base, etc.), and paste in the token contract address. The bubble map loads within seconds.
Before you read any numbers, look at the shape of the map.
A well-distributed token looks like a galaxy: many bubbles of varied sizes, loosely connected or unconnected, spread across the canvas. No single cluster dominates. The largest bubbles are typically CEX wallets, liquidity pools, or large retail holders.
A suspicious token looks like a solar system or a tight cluster of bubbles. You'll see one bubble at the center with lines radiating out to many smaller ones, all the same color. That color coding is the key feature: Bubblemaps assigns the same color to wallets it has identified as likely controlled by the same entity. If half your map is one color, half the supply may be in one set of hands.
Make this your first-pass filter. If the map looks concentrated before you've clicked anything, the token warrants much closer scrutiny before you put money in.
Step 2: Check What Percentage Insiders Control
Click into the top holder clusters and note the percentages. Bubblemaps shows each wallet's share of total supply alongside its address. Add up the percentages of any connected wallets (same color group) to get the true insider control figure.
Here's what the numbers mean in practice for meme coins:
Under 15% in a single cluster: Reasonably healthy. Even if this group sells, there's enough distributed supply that it won't crater the price entirely.
15 to 30% in a single cluster: Elevated risk. This group has enough supply to significantly suppress price if they coordinate a sell. Watch their wallets closely before entering.
Over 30% in a single cluster: High risk. A single coordinated exit by this group can drain most of the liquidity. Unless you have strong conviction and a clear exit strategy, this is a pass.
Over 50% in a single cluster: Extreme risk. The token is effectively controlled by one entity. Any price action is at their discretion. This is the profile of a token designed to be rugged.
These thresholds aren't hard rules. Context matters. A 25% cluster might be a known VC or a team wallet with a locked vesting schedule, which is very different from 25% held by anonymous wallets with no lock. Always cross-reference with what the project has publicly disclosed about its tokenomics.
Step 3: Identify the Deployer Wallet and Trace Its Connections
The deployer wallet is the address that launched the token contract. On Bubblemaps, you can often identify it through the cluster connections or by checking the wallet labels ("Deployer"/"Creator").
The deployer is important wallet to keep track on. Whatever tokens it still holds or distributed to connected wallets represents the token team's true position, regardless of what they've publicly stated.
Look for:
Tokens still held by the deployer: If the deployer wallet retains a significant share after launch, those tokens are overhang. They can be sold at any time.
Tokens sent from deployer to a network of wallets: This is the classic distribution pattern before a coordinated dump. The deployer spreads supply across twenty addresses so no single wallet looks suspicious, then they all sell simultaneously. Bubblemaps connects these wallets visually, which makes the pattern immediately visible.
Deployer wallet age and history: A wallet that was created hours before the token launch and has done nothing since is a red flag. A deployer with a longer history and diverse on-chain activity is a slightly better sign, though not conclusive.
On Solana in particular, the deployer wallet tracing is critical because the chain's low fees make it cheap to operate dozens of wallets simultaneously. Many Solana meme coin rugs involve deployers managing 30 to 50 wallets, all of which Bubblemaps will group and highlight if they're behaviorally connected.
Step 4: Run the Bundle Checker
Bundling is one of the most common manipulation tactics in memecoin launches, especially on Solana. It refers to a coordinated buy where multiple wallets purchase the token in the same block or within the first few blocks of trading, before any public buyer has had a chance to enter.
The effect is that one person, or a small group of insiders accumulates a large share of the supply at the lowest possible price, while public buyers see the chart already moving and chase the momentum. When insiders decide to sell, they exit into the retail liquidity that followed them in.
Bubblemaps' bundle checker detects this pattern by analyzing launch-block transaction data and identifying wallets that coordinated their buys. Run it on any new token before buying. What you're looking for:
Bundled supply under 5%: Low concern. Some wallets will always snipe a launch; this is within normal range.
Bundled supply between 5 and 15%: Moderate concern. Worth tracking these wallets to see if they're holding or distributing.
Bundled supply over 15%: Serious concern. A meaningful portion of the supply was coordinated at launch. These wallets have a significant cost advantage over any buyer who came after.
Bundled supply over 30%: This token was effectively pre-bought by insiders before the public had access. The launch was structured to extract value from retail buyers. Avoid.
The bundle checker result, combined with the top holder concentration, gives you a complete picture of whether a launch was fair or engineered.
Step 5: Analyze the Real-Time Token Distribution
Bubblemaps updates its data in near real time, which makes it useful not just for pre-investment research but for active monitoring of tokens you already hold.
When you're watching a meme coin you're in, there are specific distribution signals that should prompt action:
A large cluster that's been stable suddenly starts to fragment: Wallets that previously held their position are now splitting into smaller wallets and moving tokens. This is often a precursor to selling, as insiders distribute to fresh addresses before hitting exchanges. If you see this, watch the next few hours closely.
The top holder list is changing rapidly: New wallets appearing in the top 20 while old ones shrink means active trading at scale. This isn't inherently bad, but combined with other signals, it can indicate a coordinated exit in progress.
Wallet connections are increasing: More lines appearing between previously unconnected bubbles means Bubblemaps is detecting new behavioral links between wallets. Insiders sometimes consolidate before a dump.
The map is becoming less diverse over time: If the distribution is concentrating rather than spreading, retail is buying while insiders are quietly selling to them. This is the soft rug pattern.
Real-time monitoring is most useful during the first 24 to 72 hours of a meme coin's life, when distribution patterns are still forming and insider intentions are most readable.
Step 6: Use the Historical Map to Understand What Already Happened
The historical token holders map lets you scroll back to any point in the token's life and see what the distribution looked like then. For meme coin analysis, this is invaluable for understanding whether a token has already been partially exploited and what the remaining risk looks like.
Use it to answer these questions:
Did insiders already sell a large portion? If a cluster that held 40% at launch now holds 8%, those tokens have been distributed. The immediate dump risk from that cluster is reduced, though the tokens are now in unknown hands.
Did distribution get better or worse over time? A token where the top 10 holders now hold a smaller combined percentage than they did at launch has seen genuine decentralization. A token where concentration has increased despite rising price has seen insiders accumulate into retail buying pressure.
Did something specific happen at a price peak? Load the historical map from the point of the last major price top and check who sold. If a large cluster exited precisely at the peak, those wallets have demonstrated they will sell again at the next one. That's information you can use.
When did the deployer last move tokens? If the deployer wallet moved tokens three days ago but nothing has happened since, something may be being prepared. Context in the historical map often explains current price action.
Step 7: Compare Across Chains
If you're analyzing the same token concept or team across multiple chains (which happens often with meme coin series or "bridged" tokens), Bubblemaps lets you pull up token maps on different chains side by side.
The patterns to compare:
Is the deployer wallet on Chain B connected to the same clusters as on Chain A? A team that launched a suspicious token on Ethereum and is now launching on BNB Chain will often reuse wallet infrastructure. Bubblemaps can surface these connections within a chain, and manual cross-referencing between chains is straightforward once you know the deployer addresses.
Is the distribution on the new chain already concentrated? Some teams pre-position on a new chain before the public launch, using the reputation from a previous token to drive FOMO into a structure that's already insider-controlled.
Does the new token look like the old one at launch? If a previous token showed heavy bundling and a tight cluster, and the new one from the same team has the same fingerprint on a new chain, the pattern is repeating.
What to Look for in a Healthy Meme Coin
Not every meme coin is a trap. Some have genuinely distributed supply and a community of real buyers. Here's what that looks like on Bubblemaps:
Many colors, many clusters: A healthy distribution map looks chaotic in a good way. Multiple distinct clusters of different colors and sizes, many unconnected bubbles, and no single dominant entity.
CEX and DEX wallets among the top holders: When centralized exchange wallets or major DEX liquidity pools appear in the top holders, it signals legitimate trading volume and third-party custody. These wallets are not insider positions.
Deployer wallet is empty or minimal: A team that has genuinely distributed its tokens shows up as a deployer wallet with near-zero balance. Tokens went to the community, not to a network of insider addresses.
Bundle percentage is low: Under 5% bundled supply at launch means the token opened fairly. Early buyers got in through normal trading, not through coordinated pre-buy.
Distribution is improving over time: Each time you check the historical map at a later point, the top holder concentration should be trending downward as more wallets accumulate from the market. This is the natural pattern of a token gaining genuine adoption.
Building a Meme Coin Checklist with Bubblemaps
Before entering any meme coin position, run through this sequence:
Open the bubble map and assess concentration at a glance. If the map looks dominated by a single color cluster, proceed with extreme caution.
Check the top 20 holders and add up any connected wallets. Note the combined percentage. Anything above 25% in a single connected group deserves detailed investigation.
Run the bundle checker. If bundled supply exceeds 15%, understand that those wallets have a structural cost advantage over you and will likely sell before or into your exit.
Trace the deployer wallet. Note what it holds, where it sent tokens at launch, and whether any of those recipient wallets are still holding large positions.
Check the historical map at two or three key dates: launch, the first major price peak, and the most recent date. The story those three snapshots tell is usually the whole story of the token.
Make your decision based on what you see, not on the chart or the community sentiment. Both of those are downstream of the on-chain reality that Bubblemaps shows you directly.
Meme Coins Move Fast: Timing Your Analysis
One practical note on timing: meme coin analysis with Bubblemaps is most valuable in the first hour and the first 24 hours of a launch. After that, the distribution becomes harder to act on because the obvious insider wallets have often already moved.
If you're the type of trader who enters meme coins early, make opening Bubblemaps the first step, not an afterthought. The bundle checker result and the initial distribution map take about two minutes to assess. Those two minutes can be the difference between entering a fair launch and entering a coordinated trap.
If you're analyzing a token that's already been trading for days or weeks, the historical map is your most useful tool. It tells you not just where the supply is now but how it got there, and that trajectory is often the best predictor of what happens next.
The Bottom Line
Meme coins will always attract speculation, and there will always be teams willing to exploit that. Bubblemaps doesn't remove the risk from meme coin trading. What it does is make the on-chain reality visible before you commit capital.
A two-minute analysis on Bubblemaps before entering a meme coin position is the simplest and most effective form of due diligence available in this space. The map doesn't lie. The wallets don't lie. The only question is whether you look before you buy.
Want to go further? Read our guide on How to Spot a Rug Pull Using Bubblemaps (Before It Happens).