Find Deeper Connections between Wallets
Video at the end of this article. *
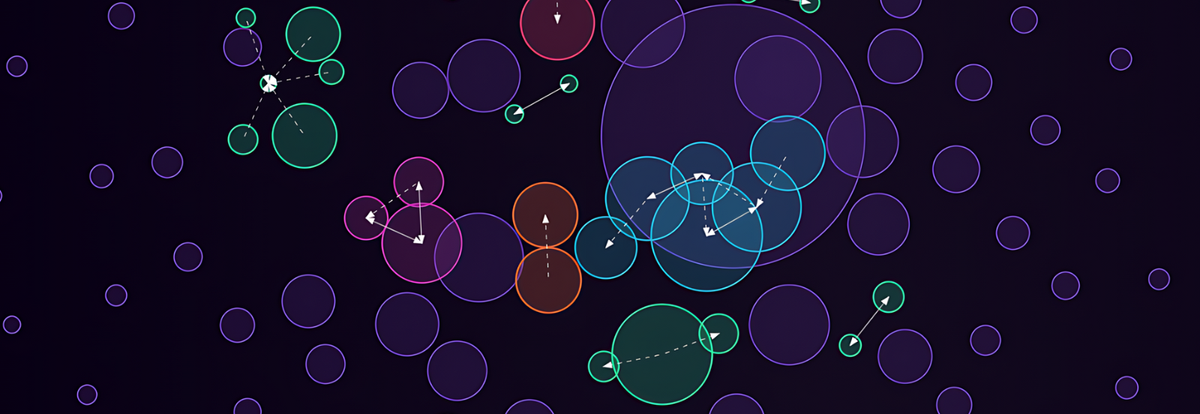
Bubblemaps introduces a ground-breaking way of exploring tokens on Ethereum, Solana, Avalanche, Arbitrum, Base, BSC, and more. A simple glance at the bubbles will reveal connections between holders.
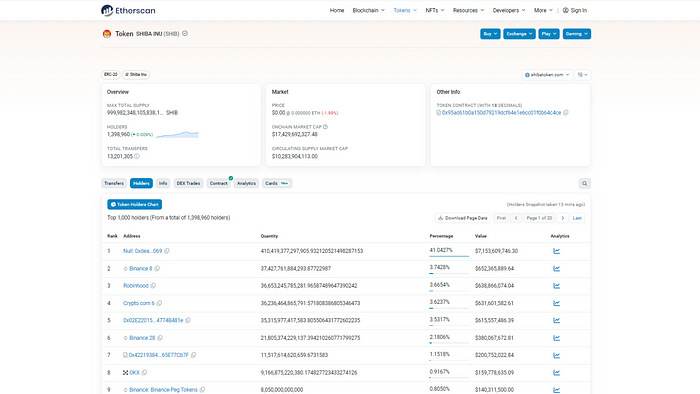
Blockchain technology has established a new era of end-to-end transparency. Block Explorers can be used to search any transaction that happened on a public network. For instance, each token has its own page on explorers (Etherscan, Solscan, Basescan, etc.) where you can check holdings and all the transactions.
Although raw data is easily accessible on explorers, building relevant insights about a token is not an easy task. By analyzing and rearranging data from explorers, intricacies of a token can be revealed, that would otherwise go unseen.
Bubblemaps: Rules of the Game
Bubblemaps leverages blockchain explorers’ raw data to create powerful visualizations. Each token has a unique bubble map that could reveal singular information and patterns about holders.
Here are the 4 rules:
- Each bubble represents a single wallet
- Only the top 150 wallets are loaded
- A bubble’s size is proportionate to its share of token holdings
- Two bubbles are connected if there was at least one historical transaction between the corresponding wallets in the gas token of that chain (ie. ETH on Ethereum, SOL on Solana, ETH on Base, BNB on BSC…).
1. Unveiling Connections
Example: Bonk (Solana)
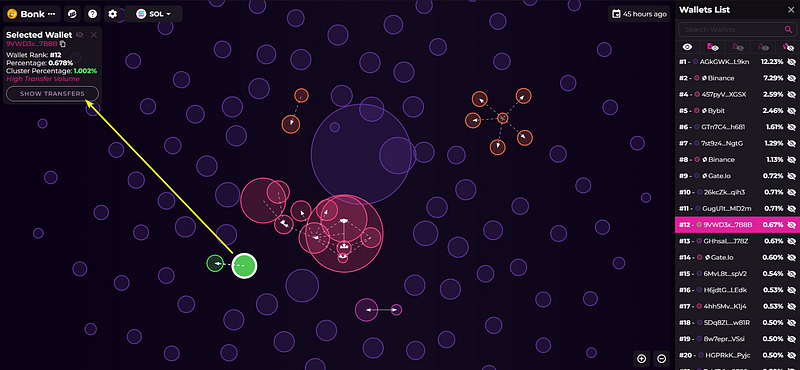
Select a bubble to have its information on the top left panel:
- Selected bubble is ranked #12
- Selected bubble is holding 0.67% of the total supply
- Selected cluster is holding 1% of the supply
- Click on “show transfers” to display all bubbles connected to the selected bubble
2. Visualizing Interactions
Example: BitGet Token (ETH)
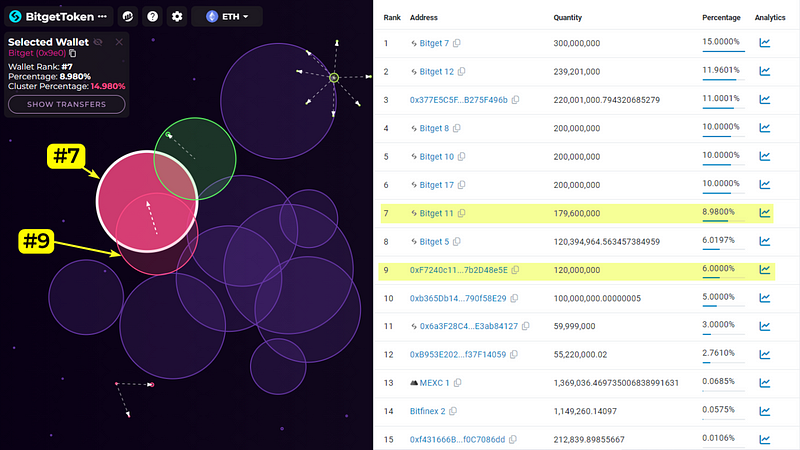
BitGet Token is a well known token on Ethereum. The Etherscan holder page of BitGet Token provides static information about the holders.
The bubble map of BitGet Token complements Etherscan by adding information about how those holders are connected. Wallets #7 and #9 are forming a cluster, meaning that there were transactions between the wallets.
- There was 1 transaction between wallets #9 and #7
- Wallet #9 sent 0.1 ETH to wallet #7, leading to their connection.
- There was no transaction from #7 to #9
A connection between two bubbles can be dotted, indicating the direction of the connecting transfer: the dotted line between these two wallets, indicate that #9 transferred ETH to #7.
Connected bubbles can also have a solid link between them, that means transactions went both ways, ie. 2 or more wallets both sent, and recieved from one another.
3. Deciphering Clusters
Example: Hellborn NFTs (Avalanche)
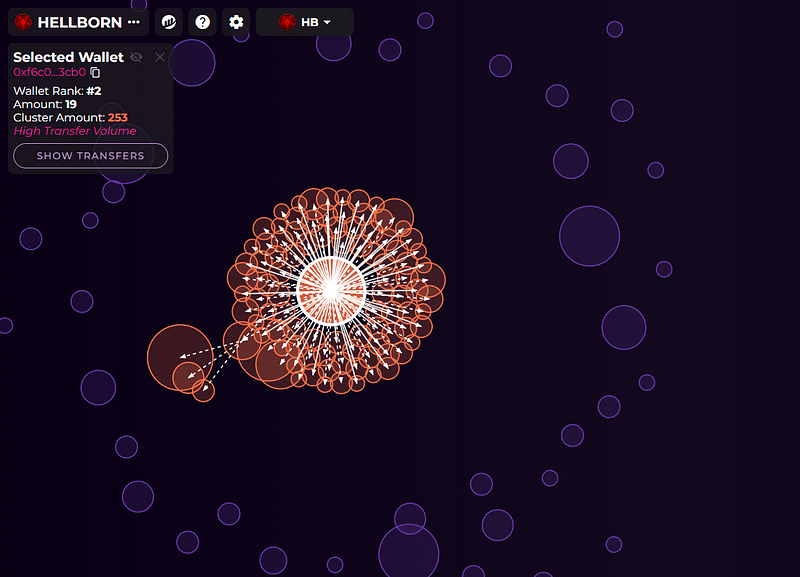
A cluster of connected bubbles (wallets) can have multiple meanings:
- Genuine transactions happened at some point in time between top wallets
- Marketing wallet has paid other wallets in the top 150
- There has been a presale
- Wallets belong to the same investor
Other interpretations might apply, make sure to do your own research before investing.
4. Identifying Patterns
Example: Turbo (ETH) Presale
The above bubble map shows that the central bubble (wallet #3) is connected to over 30 wallets. This cluster represents 40–50% of the supply.
Viewing the ETH transfers we can see that all surrounding wallets have been sending ETH to the central wallet #3.
Click on “show transfers” to see every wallet connected to wallet #3.
Swapping mode to ‘Native token’, in this case $TURBO, this cluster remains, but now shows #3 is sending outwards to all wallets.
→ ETH sent to center wallets = presale contributions
→ Tokens sent back to the same wallets = contribution in token
→ Typical cluster of a presale
5. Detecting Malicious Activity
Example: BHLTC (SOL) Malicious manipulation
Select the bubble at the center of the cluster (wallet #111) and click on “show transfers”:
- Wallet #111 is connected to 110 bubbles of significant holding (size).
- The cluster represent 91% of the supply.
- Wallet #111 has been sending 0.1 SOL to every connected bubble.
- The same wallet has also sent out 800M–900M tokens to all surrounding wallets.
→ Such large amounts in the same cluster have to be investigated.
→ Make sure to check both native token transfer, and gas token transfers (SOL).
Common red flags
Malicious teams may try to hide their intentions. Look for these red flags in clusters:
- How much of the supply does the team own?
- Are the wallets locked?
- Are wallets in the same cluster selling a lot?
Bigger clusters are riskier since one person can impact the price heavily.
Watch this 2 min video to learn more about Bubblemaps V2: